|
A key aspect of the course is understanding how we record weather data and put this into place to generate models and predictions which inform responses to the hazards.
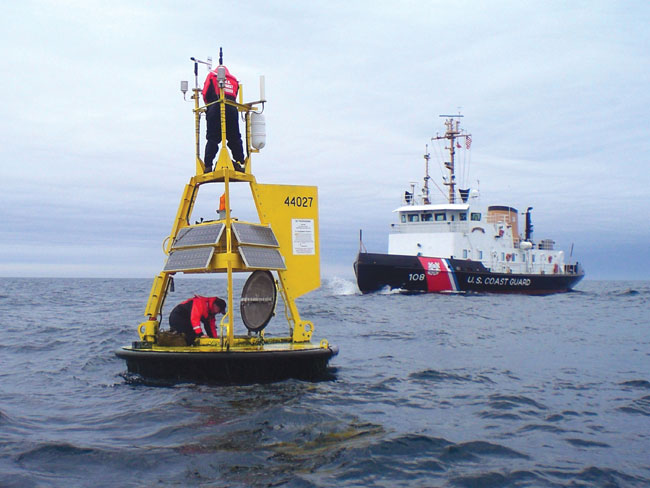
Your task is to create an intricate flow diagram of recording, processing, delivering of information about an extreme weather event as it develops in the UK. Here is an example to help you get started. 1) Warm ocean temperatures recorded in the North Atlantic by Ocean Bouys. 2) High levels of humidity measured in airmass above north atlantic by ship mounted Hygrometer. 3) AMDAR data informs MET Office of extremely low temperature airmass traveling towards the UK under the influence of the polar Jet Stream. |
| ||
