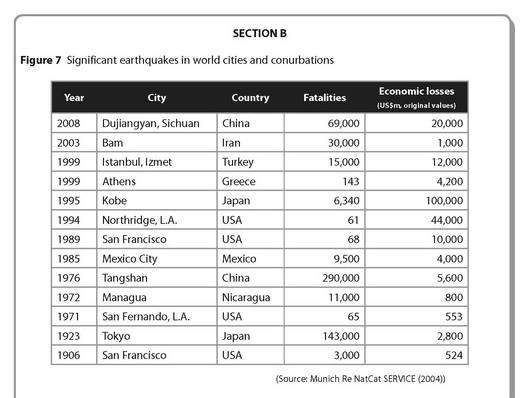
(a) Suggest reasons why these earthquakes had such varied consequences. (10)
(b) Explain the distribution of the world’s major geophysical hazards. (15)
What the Examiner had to say, taken from Edexcel website.
In part (a) many candidates effectively used the table to structure and support their answers, with the
best using pretty much the full range of data supplied in addition to their own examples. Level 3 answers
typically discussed a good range of causes not given in Figure 7, such as the magnitude of earthquakes
and time of day. The best answers also mentioned places such as San Francisco and Japan having better
technology and buildings that can withstand earthquakes. The stronger answers also discussed locations
such as Bam in Iran, where the buildings are poorly built, resulting in more deaths.
Weaker answers simply focused on fatalities and gave a few general reasons why people died - such as not
been prepared, or poorly built buildings. A commonly recurring mistake that was seen consisted of students
reporting that “LEDCs” lack any technology to predict the earthquakes whereas “MEDCs” do have some sort
of predictive technology – and of course they sadly have nothing of the sort.
Problems for weaker candidates in part (b) centred around the adoption of a descriptive approach to the
question, a tendency to introduce a discussion of the possible consequences of earthquakes; a lack of
specifi c detail and a tendency to write about hydro-meteorological hazards in addition to geophysical ones.
The majority of the better quality responses were able to explain the distribution of two types of
geographical hazard but few were able to construct and produce a wide ranging account. The most popular
locations quoted were California and the Philippines. The very best answers showed excellent understanding
of the mechanisms of plate movements, attempted to tackle the idea of a mass movement distribution
(perhaps linking it with coastlines) and wanted to discuss the idea that the greatest hazards exist where the
greatest number of people are also found.
